MLB Stats Visualized with 3D Printing

Daren Willman, Director of Baseball Research at MLB.com, is creating 3D printed visualizations of Statcast data.
Of the many spheres of human activity benefiting from Information Age technology, sports analysis is certainly near the top. Where before sports know-how relied on experience and speculation, today’s enthusiasts can build strong theories supported by endless charts of statistics.
Of course, looking at infinite lists of numbers gets pretty boring pretty fast. Enter Daren Willman, Director of Baseball Research at MLB.com, and his 3D printed visualizations.
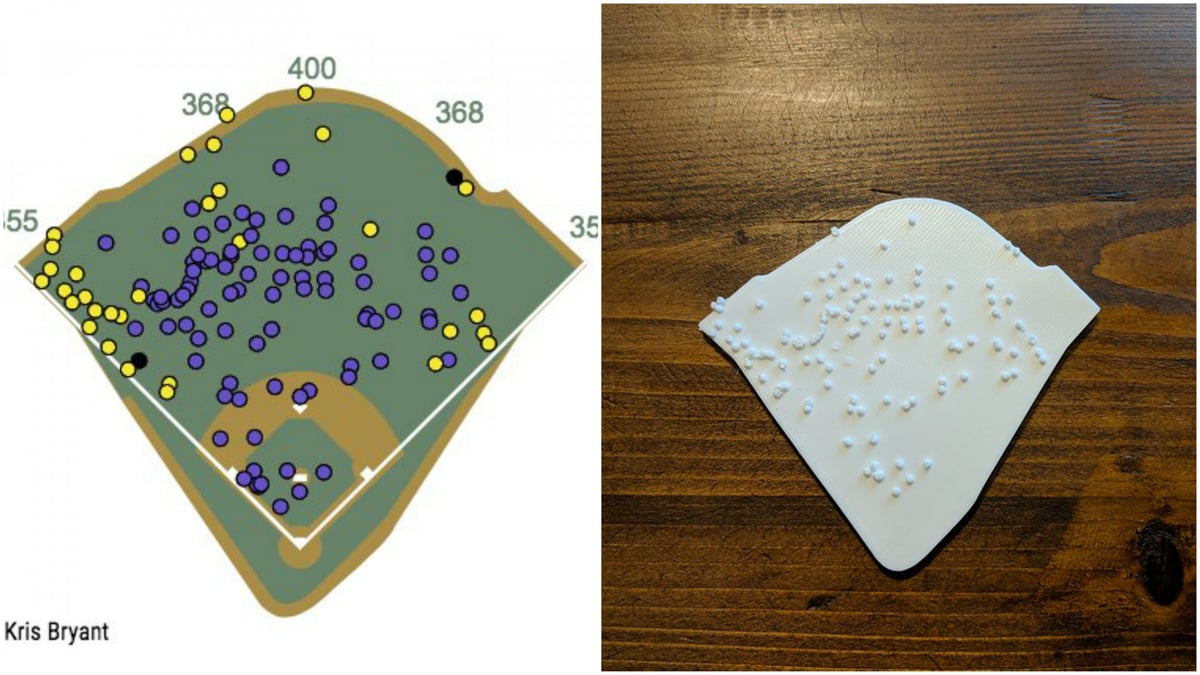
The data comes from Statcast, an automated analysis tool and database for Major League Baseball (MLB). This information at his disposal, Willman intuitively presents it in 3D by overlaying player tracking data onto stadium models.
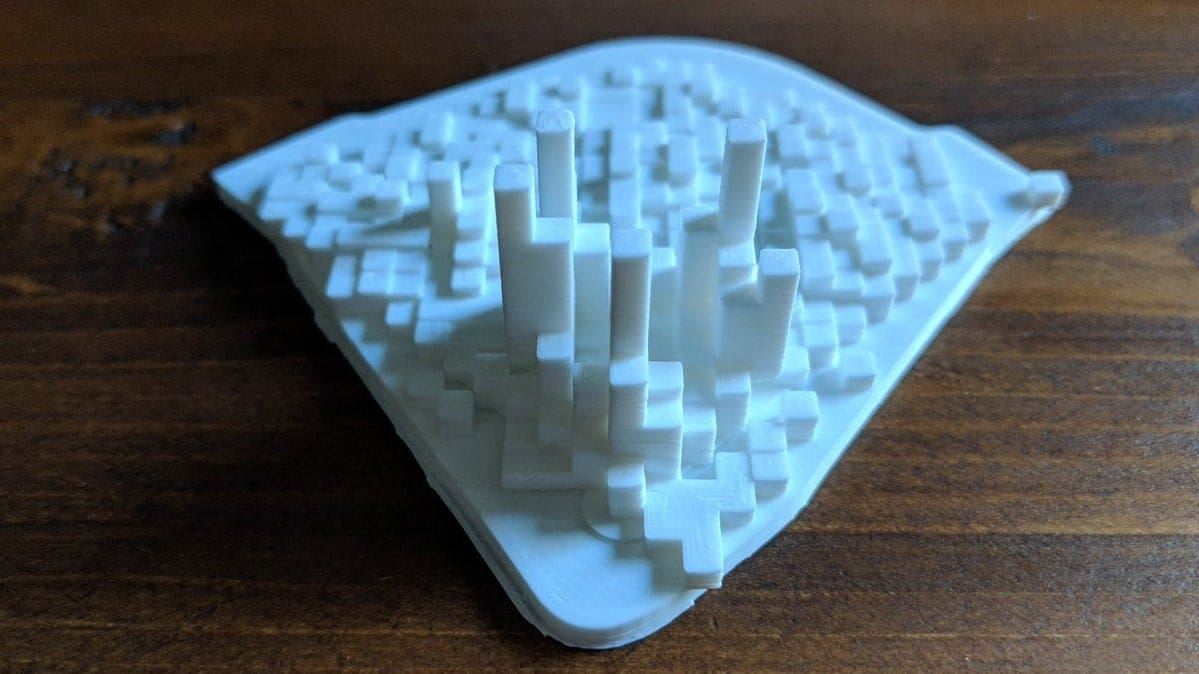
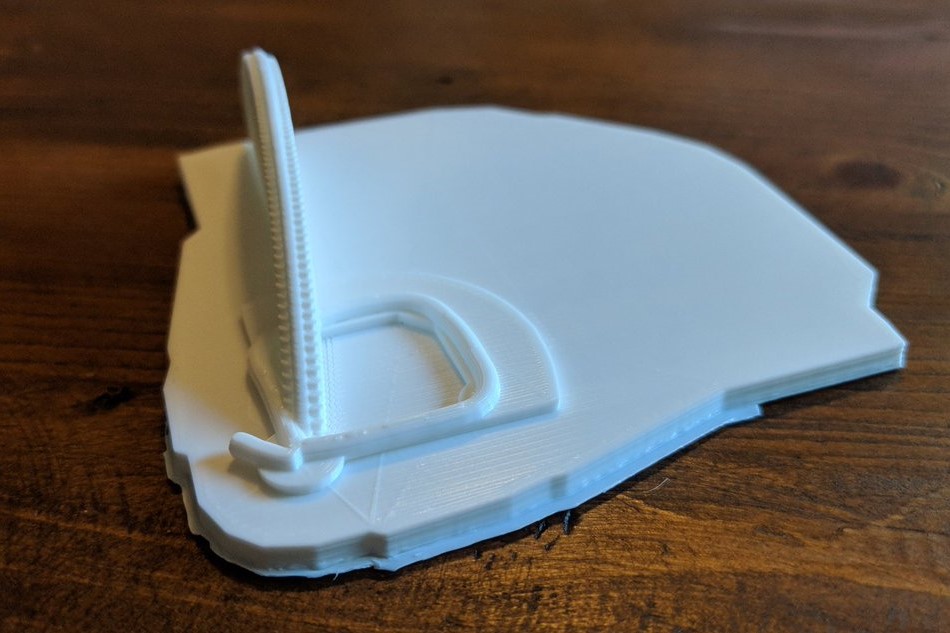
One such model shows last season’s density of batted ball locations at Wrigley Field, home of the Chicago Cubs. Another displays the trajectory of Bartolo Colón’s now legendary home run.
In case you missed it, Colón struck the home run, his first in a 19-year career, in May 2016, giving the New York Mets a 4-0 lead. It made him the oldest player with a first career homer, at the age of 42.
How to Make 3D Statcast Models
Willman designed the models using Three.js, a lightweight JavaScript API for generating and displaying 3D graphics in a web browser. He first imported MLB’s existing stadium models and then layered them with data taken from Statcast.
The resulting STL files were passed on to Cura. Willman’s 3D printer is a Monoprice Select Mini and for filament he used PLA.
According to him, each print takes about eight hours. Currently the models are proprietary, but his hope is to eventually make the STL files available to the public. The models he’s made so far will likely be sold for charity.
Willman comments on the experience so far: “I’ve only had the printer for a few weeks, so I’m still a novice in the 3D printing realm, but plan to keep iterating on some of the ideas I have.”
Source: MLB Cut4
License: The text of "MLB Stats Visualized with 3D Printing" by All3DP is licensed under a Creative Commons Attribution 4.0 International License.